Paving the Way for Smarter Investments
Vehicle-mounted technologies provide a clear picture of road conditions while saving man-hours, traffic headaches
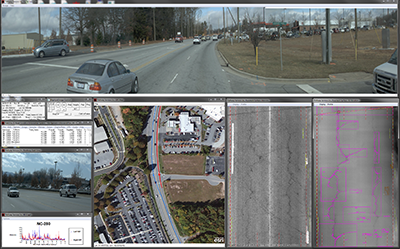
On a North Carolina interstate, a van cruises with traffic at 65 miles per hour while taking 1,000 pictures per mile. A half-dozen 2-D and 3-D cameras mounted on the vehicle—some trained forward, others sideways or straight down at the road—capture a high-definition view of its surroundings.
Back at the lab, these images will be reconstructed in painstaking detail to form a virtual reality, one in which no flaw of the highway’s pavement will be overlooked. Every crack, loose stone, pothole and rut will be visible, complete with geocoded data available to pinpoint its exact location.

A combination of high-definition photos, 3-D imagery, GPS data and other
information compiled by Pathway Services vehicles show road conditions at precise
locations in North Carolina.Guided by specialized algorithms, computers will scour the data looking for problems. The results will shape the North Carolina Department of Transportation’s (NCDOT) pavement preservation and contract resurfacing programs, which determine the areas that will be repaved in the year ahead.
State transportation agencies are increasingly turning to high-speed, vehicle-mounted imaging technologies to survey the condition of their highway networks. It’s a job that has historically been handled by crews driving slowly along the road shoulders, taking notes on what they saw and occasionally getting out to measure cracks with rulers.
Some of the advantages of the new method are self-evident, such as the reduction in man-hours necessary to survey the roads and the far more accurate readings. But the most important improvement cited by practitioners is one that may be less obvious: the heightened safety of workers and the traveling public.
“I don’t know how many times [we’ve been driving] with our caution lights flashing and our overhead strobes on … and somebody pulls over in front of us thinking we’re a cop,” said Randy Finger, state pavement management systems engineer for the NCDOT.
The more surveyors the NCDOT can get off its road shoulders, the better, Finger said. North Carolina now employs a contractor to electronically survey 20,000 centerline miles of its primary highway system each year.
The NCDOT is in its fourth year of automated surveying, and the technology appears poised to change business in some major ways. For these first few years, which Finger acknowledged presented a learning curve, the NCDOT combed over the data and filed its findings using the same old system and classifications it always had. The NCDOT is currently working with researchers at the University of North Carolina-Charlotte to re-imagine what can be done with the new trove of data. For example, now that the agency can directly compare multiple consecutive years of imagery, it can examine whether the deterioration assumptions it has always used for planning purposes are accurate, or whether the ways they score pavement conditions are still appropriate.

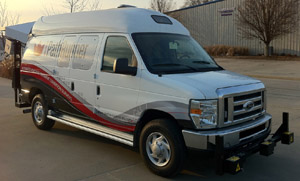
A 3-D camera-equipped PathRunner vehicle in Pathway
Services' fleet.Highway departments are only scratching the surface of what’s possible with the historical data, according to Scott Mathison, vice president of operations for the Tulsa, Oklahoma-based Pathway Services, which conducts the NCDOT’s surveys. With years or decades of data, agencies will be better equipped to spot trends, make more educated investments and diagnose problems before they worsen, saving considerable funding.
Already, agencies are discovering valuable alternative uses for the data. Many states have asked Pathway Services to review their imagery and inventory the location and condition of assets like signs, road shoulders and guard rails.
“It’s data they already had. All we did was spend a month or two and create a whole new dataset that they drastically needed to make better decisions,” Mathison said. “It’s what we call ‘data-mining’ in our industry—taking what you already have and making the most of the resources in place.”
LIDAR and GPR
In the days following Superstorm Sandy, Rutgers University used a similar configuration of technology to survey storm-ravaged neighborhoods in Ocean County, New Jersey, as well as Staten Island and the Rockaways in New York City. A van outfitted with four 2-D cameras and two light detection and ranging (LIDAR) sensors scanned 80 miles of roadway, utilities and buildings to map the extent of the damage wrought by the storm. LIDAR emits pulses of laser light that bounce through the environment and reflect back to sensor equipment with information that can produce a 3-D view of the area.
Gathering a million data points per second, the van eased along at 10-20 miles per hour—well slower than the highway pavement scanners, but fast enough to accomplish in a day what would have taken months for inspectors on the ground. According to project lead Dr. Jie Gong, assistant professor or civil and environmental engineering at Rutgers, driving faster is possible but would yield more sparse data. Plus, the condition of the roads presented safety concerns.
“When you’re in a disaster zone, you don’t have the luxury of driving fast,” Gong said.
The data collected by Gong’s team is being analyzed to determine how infrastructure and building materials hold up to extreme wind conditions and flooding. The results will help planners, engineers and government leaders make decisions on developing in coastal areas and preparing for future extreme weather events, according to the university. It was the first time that mobile LIDAR was employed at such a large scale for disaster analysis, Gong said.

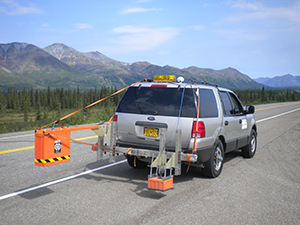
An Infrasense van scans an Alaska highway with
ground-penetrating radar (GPR).
Some are taking an even deeper look at the roads with vehicle-mounted technologies. Infrasense, of Woburn, Massachussets, uses a ground-penetrating radar (GPR) system to scan conditions beneath road and bridge surfaces while driving at highway speeds.
GPR readings illustrate the exact thickness and boundaries of separate pavement layers, which is valuable information for planning rehabilitation projects, according to Infrasense Operations Manager Adam Carmichael. It can also detect “voiding”—air pockets beneath the pavement that can fill with moisture and lead to damages ranging from depression to potholes.
“It’s expensive to go out and reconstruct and entire road,” Carmichael said. “If voiding is more localized, as opposed to a more systemic issue, it’s good to have data that shows you where these voids are so you can take care of the issue in those specific locations.”
A manual method for investigating the extent of voiding involves drilling holes in the road, he said, while the standard for spotting problems on bridge decks is to drag chains across the surface and listen for hollow-sounding spots. Carmichael said GPR produces more consistent, quantitative results without causing traffic slowdowns or lane closures.
Limitations and Future Potential
The shortcomings of the technologies stem from their own effectiveness. Due to the sheer volume of data collected, a high percentage of the time saved by getting manual surveyors off the street is offset by the time required to process and analyze the data in the lab.
As Finger noted, any problems flagged by the software must still be reviewed by humans to ensure their accuracy. The NCDOT employs two independent teams of contractors to review the data, with agency staff stepping in for a closer look when conflicting findings are reported.

Infrasense readings indicate the severity and locations of
voiding beneath a road surface.“It’s still not a perfect solution by any stretch of the imagination,” Finger said. “But we definitely feel that we’re getting better, more consistent data.”
Mathison acknowledges the current processing limitations, but is confident that improvements are on the way. He envisions a time in the near future when it will be possible to post all of the imagery and analysis online for review the same day it was collected. He expects it will also be easier to tailor the search algorithms to give individual states exactly what they’re looking for.
Carmichael believes the greatest opportunity for improvement is less a matter of technological advancement, but in merging techniques to produce the most comprehensive results. Marketers tend to oversell GPR and related technologies as “one-stop solutions,” when in reality, each technology is good for certain tasks and less effective for others.
“I think the future really is combining,” Carmichael said. “Everyone is talking about data fusion and combining different methods, fully understanding their capabilities and limitations. … The way the information is combined, utilized and then presented—that’s going to be the next major change.”
Karl Vilacoba is the managing editor of InTransition.