NJTPA
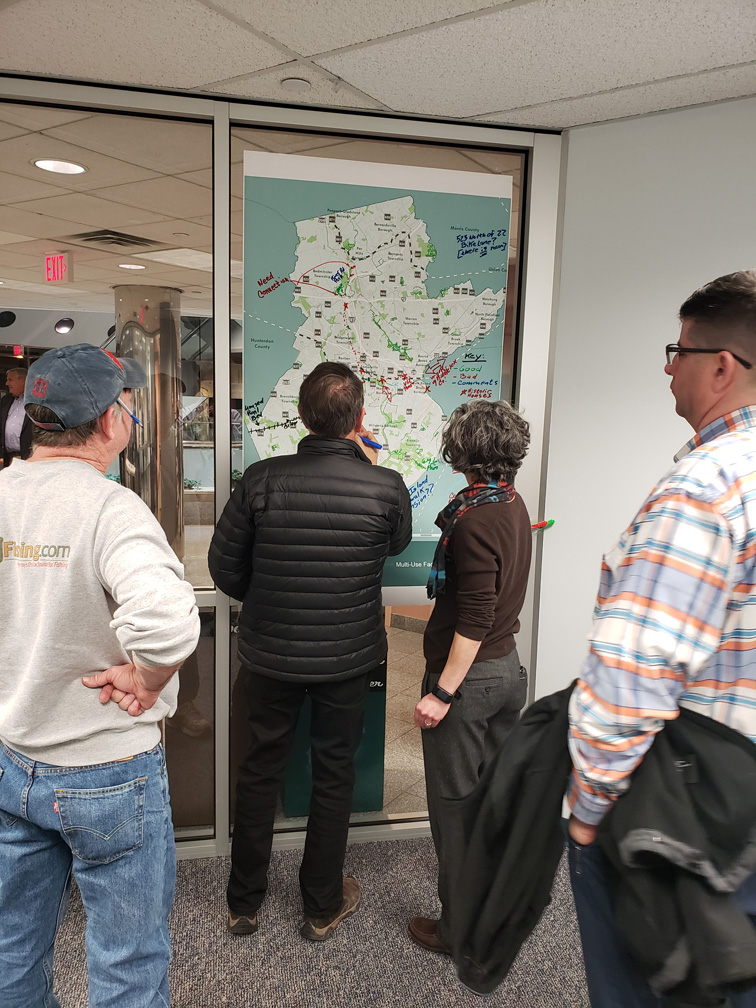
During a public meeting for the Walk, Bike, Hike
Somerset County study people were asked to provide
feedback by writing on a map. It’s been said that every map tells a story. So can several hundred form a transportation plan?
Transportation agencies are increasingly turning to participatory mapping as a means of collecting data that can inform their planning and investment decisions. Through this public outreach method, participants are asked to share their knowledge on a subject—such as frequent gridlock locations or places they’d like to see bus stops—by applying it to a map.
Participatory mapping has traditionally been done on paper, either in groups or individually. But in the GIS age, the tools have become increasingly more sophisticated, allowing for the collection of enormous datasets and the production of interactive maps that can reveal important travel trends.
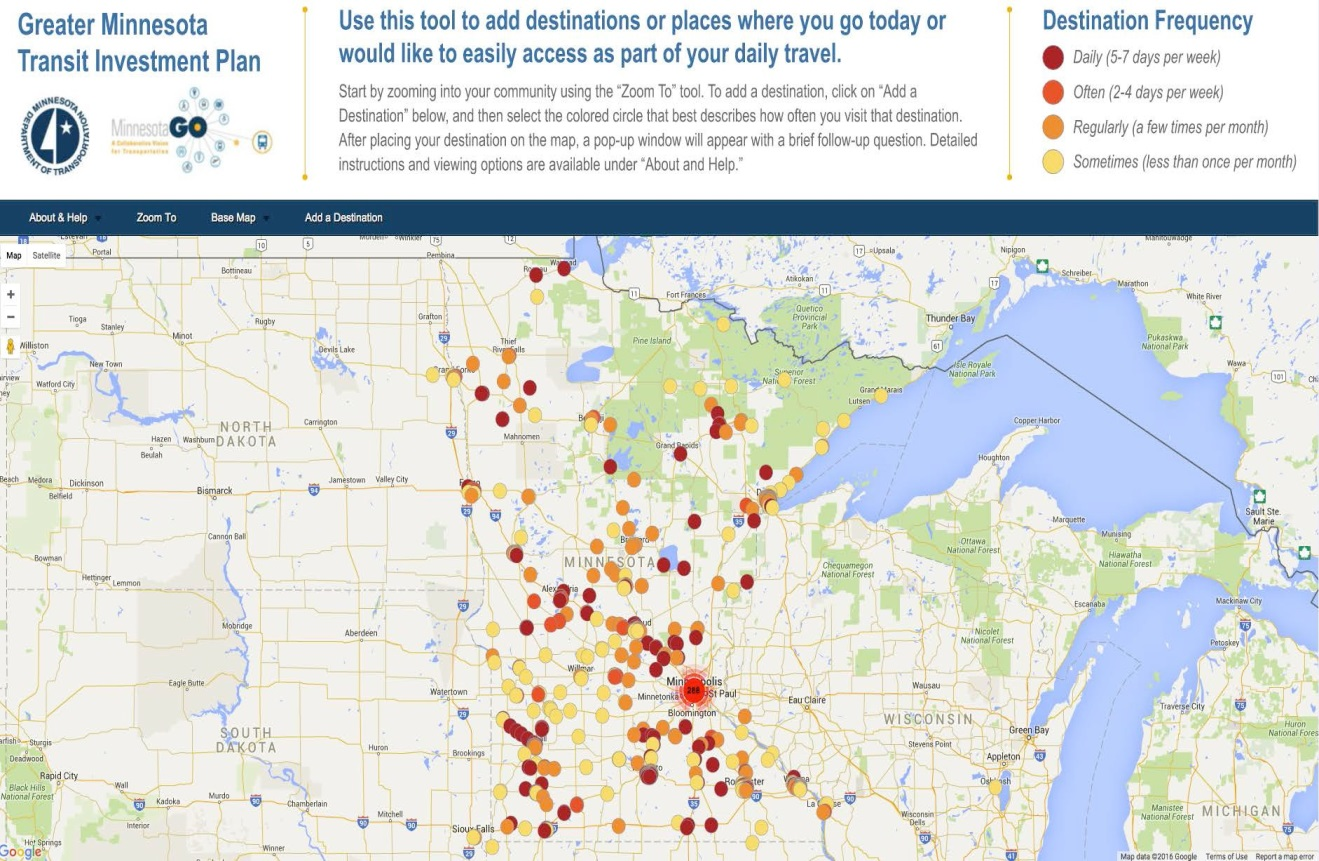
The Minnesota Department of Transportation (MnDOT) used participatory mapping in 2015 and 2016 as part of the outreach for a 20-year strategic investment plan for the state’s public transportation systems. The agency set up an online Wikimapping platform that asked Minnesotans to mark the origins and destinations for their typical travels, using color codes to denote whether they make the trips on a daily basis or less frequent. For the less tech savvy, an option was provided to enter the addresses manually. That data was later geocoded and combined with the Wikimapping results to comprehensively map and analyze travel patterns.
Sara Dunlap, a principal planner in the MnDOT Office of Transit and Active Transportation, said the results backed up something the agency already knew—commuters were traveling longer distances and relaying on a growing number of transit connections. The mapping exercise was coupled with a questionnaire component that found, among other things, that residents viewed a lack of access and inconvenient scheduling as barriers to riding public transportation.
“The geographic points on the map helped us to validate and be able to show that people are coming across county lines and we need to support intercity transit,” Dunlap said. “And the other part is that we need to make transit more available for people to use it, so it’s reliable, efficient, effective, convenient—all of those things.”

Minnesota Department of Transportation
Minnesota Department of Transportation used Wikimapping to get information about where residents are travelling to and from.
MnDOT shared the link through targeted social media ads, email listservs, the transit agencies’ websites and other means, garnering 1,481 responses from 341 unique users. Dunlap said it drew the highest level of participation in the Twin Cities metro area, where Internet access is widespread. That points to the continued importance of offering alternative options for more rural areas, she said. For example, the state sent self-addressed stamped envelopes with paper questionnaires to residents in the less-populous regions to make sure their feedback was represented. For those considering participatory mapping exercises, Dunlap also stressed the importance of having an outreach plan that properly accounts for those with disabilities, such as the visually impaired.
“You have to vary your methods. You can’t rely on online media alone, or you will be eliminating an entire segment of the population who will not access it,” Dunlap said.
Like MnDOT, the North Jersey Transportation Planning Authority (NJTPA) and its partners have used paper maps and digital maps to gather public input for planning studies.
When the NJTPA was developing a plan to create a continuous greenway along the route of the historic Morris Canal, it launched an online Wikimap where people could identify existing and planned trail segments, as well as impediments to building the trail, such as developments that had been built since the canal was decommissioned in 1924. Paper maps were also used at meetings with municipal and county officials, stakeholders and the public. In addition to helping identify a route, the maps also allowed participants to identify historic features, businesses and other attractions in the vicinity of the canal, all of which are highlighted in the Morris Canal Greenway Corridor Study report.
One of NJTPA’s partners, Somerset County, New Jersey, is using mapping as part of its study to create an integrated network of multi-use trails, paths and bicycle infrastructure in the county. As part of its Walk, Bike, Hike Somerset County study, the county developed a map of existing on-street bicycle facilities, pedestrian trails and multi-use facilities. During a public meeting in November, participants were invited to identify destinations, needed connections and areas along the existing network that need improvement.
“The study and the improvements that will come from it are only as good as the feedback we receive from our communities,” said Walter Lane, Somerset County’s Director of Planning. “Each citizen residing in the county is a key stakeholder who harnesses the power to forge the vibrant connections of which we are so proud.”
Karl Vilacoba is a freelance writer based in New Jersey.