November 14, 2022
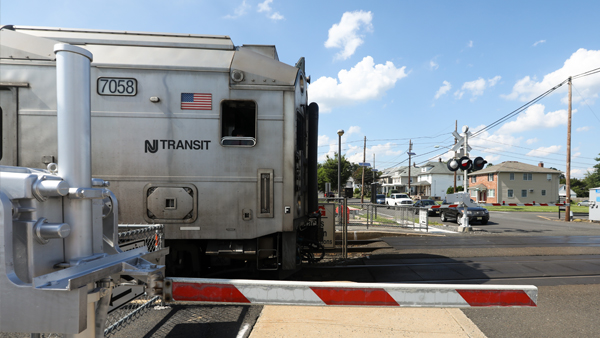
Transit Agencies Vulnerable to Cyber Incidents

Public transit agencies in the U.S., which depend on vendors to help deliver and maintain critical technologies, are vulnerable to cyber incidents, according to new research. “Aligning the Transit Industry and Their Vendors in the Face of Increasing Cyber Risk: Recommendations for Identifying and Addressing Cybersecurity Challenges,” from the Mineta Transportation Institute (MTI) focuses on three key areas: cyber literacy and procurement practices; the lifecycle of technology when it comes to transit hardware; and the importance of embracing risk as a road to resiliency.
According to the report, transit agencies need to use the procurement process as an opportunity to articulate their cyber needs because the presence of such requirements in requests for proposals (RFPs) is a key driver of investment for vendors.
Hardware and software lifecycles in public transit are out of sync, creating a situation in which vehicles and other hardware designed to last for 15 years or more are being supported by or carrying software that stopped receiving security updates five years after it was launched, according to authors. “This disconnect creates serious vulnerabilities." Multiple vendor interviews highlighted the importance of viewing organizational needs through lenses that focus on risk and security. Transit agencies and their stakeholders can strengthen their collective cybersecurity posture including requiring that vendors for critical systems make available a security lead to assist the agency in the management of the agency’s risk. They should establish periodic and independent security audits and penetration testing of their environments.
Transit agencies should also integrate their cyber risk management program with their existing physical security risk management organization and infrastructure, creating a holistic Enterprise Risk Management program. They should also elevate security within the organization by appointing a Chief Security Officer (CSO).
The study called on federal agencies and Congress to take steps to bolster cybersecurity for transit systems around the nation.
The full report can be found at transweb.sjsu.edu/research/2113
—Mark Hrywna
Rail Construction in U.S. Costs More, Takes Longer to Finish
Rail transit construction projects in the United States pay a premium of roughly 50 percent per mile compared to projects in 10 peer countries and take about 8.5 months longer, on average, to complete, according to a recent report by the Eno Center for Transportation. On the Right Track: Rail Transit Project Delivery Around the World, a 27-page report released in September, examined more than 100 projects constructed in the last two decades.
The average cost per mile for primarily tunneled projects in the United States essentially doubles when New York City is included: $1.3 billion compared with $582 million, which is closer but still more than Japan ($569 million) and Germany ($509 million). Since 2000, there have been relatively few tunneled lines completed in the U.S., according to the report. The U.S. ranked third ($132 million) in average cost per mile for primarily at-grade lines, behind Mexico ($175 million) and Japan ($202 million). The report also examined case studies in Australia, Canada, Chile, Italy, Norway, and South Korea.
To establish a common baseline, Eno evaluated governance, regulation, finance, and construction on 132 rail transit projects completed in the 10 nations since 2000.
“Despite the wide cost variation for both tunneled and at-grade projects, we found no discernable relationship between a country’s transit construction costs and its system of government, level of centralization in planning and financing, or use of common versus civil law.”
At-grade projects in the U.S. take, on average, three months longer to construct, while below-ground projects take more than nine months longer than similar projects abroad.
The report is at a loss to explain the cost and timeline premium in the U.S. but makes several recommendations in the areas of governance, processes, and standards:
- Leaders in the U.S. need to increase the public and political appeal of building rail transit.
- Project sponsors need to focus on making sure their institution has the right governance, authorities, and staff to lead a megaproject.
- The most successful projects use traditional methods but agencies should consider procuring projects using public-private partnerships (P3s) when warranted.
- Project sponsors should keep construction contracts relatively small, even if it means breaking up lines into segments.
- Project management and oversight need to be led by public sector staff.
- Frequent, early stakeholder coordination needs to be a priority.
- It’s important to gather public input on project details, but project managers should be empowered to make decisions without subjecting every detail to lengthy community consultation.
- The U.S. should learn from other countries’ efforts to further streamline reviews for environmentally beneficial transit projects.
- The public sector should refine and improve formalized assessment models to better evaluate projects and bidders.
- Transit agency staff should participate in study tours and learn about best practices in other places.
—Mark Hrywna
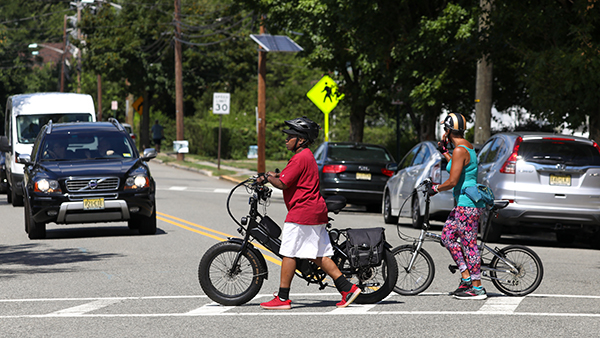
Big Vehicles Result in More Severe Pedestrian Injuries, Hospital Charges
Larger vehicles are involved in pedestrian and bicyclist crashes with more severe injuries that result in higher hospital charges, according to a new research paper, while children are eight times more likely to die when struck by a sport utility vehicle (SUV) compared with those hit by passenger cars.
“Effects of large vehicles on pedestrian and pedal-cyclist injury severity” examines the relationship between the type of vehicle striking pedestrians and cyclists and the medical outcomes of their victims. The paper, by Mickey Edwards and Daniel Leonard, was published in the Journal of Safety Research, a quarterly, peer-reviewed academic journal that covers all aspects of safety and health research. The paper linked Illinois crash and hospital records for the years 2016 through 2018, using an advanced method developed by the National Highway Traffic Safety Administration (NHTSA).
Children are eight times more likely to die when struck by a sport utility vehicle (SUV) compared to those hit by a passenger car.
Fatalities among motorists, pedestrians, and bicyclists alike were on the decline in the United States starting around 1980 but diverged in 2009 as pedestrian and bicyclist fatalities began rising—an increase that coincides with the rise of large vehicles on American roads, continuing a trend that began years earlier.
Passenger car sales in the U.S. dropped at an annual rate of 2.4% from 2008 to 2018 while pickup truck sales increased at an annual rate of 6.4%. In 2008, light trucks were about 40% of light vehicles produced and by 2018 they were nearly half.
Pedestrians struck by a pickup truck were 50% more likely to be killed compared to those struck by a passenger car while those hit by light trucks (including SUVs, vans/minivans, and pickup trucks) had higher rates of severe brain injury (33%) relative to those hit by cars.
The true scope of pedestrian and bicyclist crashes could be worse than can be estimated by relying only on crash databases, according to other studies cited in the paper. Pedestrian and bicyclist crashes disproportionately affect poor and minority communities, perhaps to a greater degree than previously believed. Blacks were found to be overrepresented as pedestrian and bicyclist crash victims.
—Mark Hrywna
California: Decline in traffic congestion increased crash severity after pandemic
Highway travel and motor vehicle crashes dropped substantially in California during the response to the COVID-19 pandemic but the frequency of severe crashes increased because of lower traffic congestion and higher highway speeds.
“This ‘speed effect’ is largest in counties with high pre-existing levels of congestion, and we show it partially or completely offsets the ‘VMT effect’ of reduced vehicle miles traveled on total fatalities," write Jonathan E. Hughes, Daniel Kaffine, and Leah Kaffine in “Decline in Traffic Congestion Increased Crash Severity in the Wake of COVID-19,” published in the Transportation Research Record.
Highway driving decreased by about 22 percent and total crashes decreased by 49 percent in the first 11 weeks of the pandemic, according to the 12-page paper. Average speeds increased by 2 to 3 MPH across California and in some counties increased as much as 10 and 15 MPH. The proportion of severe crashes increased almost 5 percentage points, or 25 percent. “While fatalities decreased initially following restrictions, increased speeds mitigated the effect of lower vehicle miles traveled on fatalities, yielding little to no reduction in fatalities later in the COVID period,” according to the study.
Since many parts of the U.S. experienced similar reductions in VMT as California, results likely generalize to congested urban highways outside the research sample. Policies aimed at reducing highway fatalities should focus on the causes of severe crashes, the authors advocate.
“Our estimates show reductions in driving led to a substantial drop in total crashes, due in large part to a reduction in minor crashes. However, speed increases from lower congestion led to a greater proportion of severe crashes and increased fatalities. Policies aimed at reducing all types of crashes could have the unintended effect of increasing fatal crashes.”
—Mark Hrywna
Traffic Deaths Surge In U.S.
Despite a decline in driving rates during the pandemic, the U.S. saw a surge in traffic deaths and continues to be an outlier among developed nations.
Smart Growth America’s Dangerous By Design 2022 was based on average yearly deaths per 100,000 people from 2016 to 2020. The report used data from 2016 to 2020 because it takes time for all data for a year to come into the NHTSA’s Fatality Analysis Reporting System (FARS).
The U.S suffers higher traffic crash deaths than 28 other developed nations, which have a much better safety record before COVID and saw pedestrian fatalities decrease during the pandemic despite other variables being the same. Walking trips increased in every state and metro area regardless of weather, climate or demographics but more walking led to more deaths, despite a reduction in traffic.
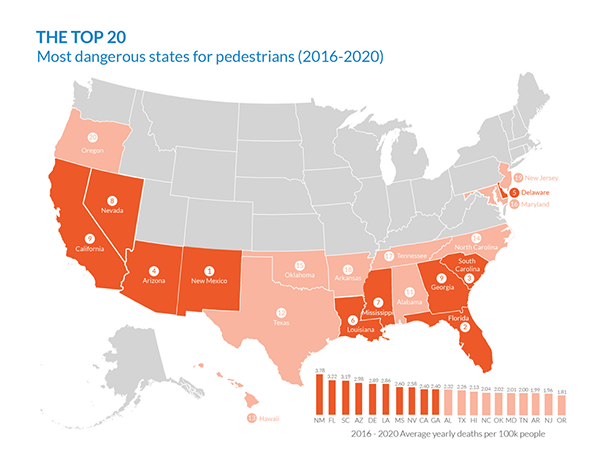
Florida led the way with seven of the top 20 most dangerous metropolitan areas, followed by California with four and North Carolina with three. Only 19 of the 100 metropolitan areas saw fatality rates decline, albeit with marginal decreases, while 81 metros got worse.
Some 60 percent of 2020 deaths occurred on non-interstate, arterial highways, which only make up about 15 percent of roads. Perceptions are important when people decide whether to walk to the local store or to school. Only 1 in 7 people, about 14 percent, said they have access to streets that make walking safe and easy.
A third of those surveyed said they live in neighborhoods where drivers followed speed limits.
“Low-income communities are significantly less likely to have access to parks and other opportunities for safe recreational walking and are less likely to have sidewalks, marked crosswalks, and street design to support safer, slow speeds,” according to the report. "Lower-income neighborhoods are also much more likely to contain major arterial roads built for high speeds and higher traffic volumes at intersections, exacerbating dangerous conditions for people walking.”
Early estimates from the Governors Highway Safety Association (GHSA) haven’t shown much improvement: 7,485 people walking were struck and killed in 2021, which would be the highest number in 40 years. It would be one of the largest single-year jumps in decades, between 11 percent and 13 percent in one year. The latest estimates from the National Highway Traffic Safety Administration (NHTSA) showed marginal improvement during the second quarter of 2022, with fatalities down almost 5 percent, but still up 0.5 percent for the first half of 2022 after a 7.3-percent spike in the first quarter.
—Mark Hrywna